The department has nine dedicated staff members teaching both ‘O‘ and ‘A‘ Level students. The teachers below handle the classes in the department:
| 1 | Mr. Okello Sam | Head of Department, BSc Educ |
| 2 | Mr. Ojangole George Francis | BSc, PGDE, MSc Phy |
| 3 | Mr. Apedu Joseph | BSc Educ |
| 4 | Mr. Ejopu Enoch | BSc |
| 5 | Mr. Odeng Bosco | BSc |
| 6 | Mr. Atung Dominic | BEd |
| 7 | Mr. Emong Emmanuel | BSc Educ |
| 8 | Mr. Elap Israel | BSc Educ |
| 9 | Mr. Kiprotu Moses | BSc Educ |
How the department is run
The Physics Department is run by all the teachers in the department, spearheaded by the HOD,
who is the liaison between staff and administration.
We place a great emphasis on teamwork, and teaching is done by all the teachers
assigned to the various classes.
Stock:
- The department is stocked with apparatus and equipment necessary for carrying out practical lessons at both ‘O’ and ‘A’ Levels.
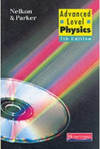
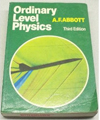
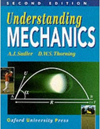
- Not enough textbooks to meet the increasing numbers of students every year.
Achievements
- Continued improvement of results at UCE and UACE UNEB Examinations (see summary of results below)
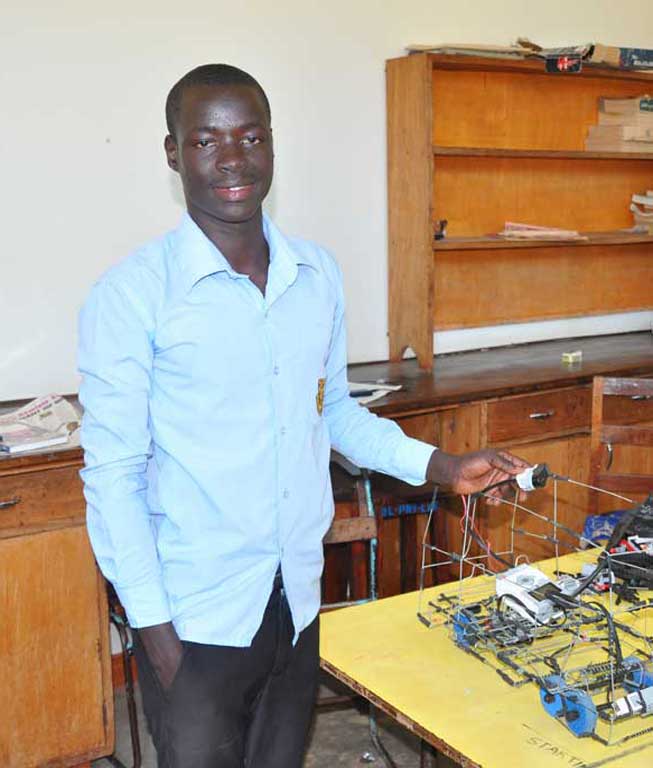
- Formation of Physics Club that has helped to boost academic performance
- Design of Physics practical manual/workbook for both ‘O’ and ‘A’ Level students to aid in doing practical work. Team teaching has been very consistent and effective.
Needs for the department.
- More teachers should be recruited to the department.
- More textbooks should also be bought.
- Junior laboratories with enough space should be renovated to help handle more students.
Challenges
- Rising number of students studying the subject at ‘A’ Level.
- Not enough teachers in the department.
- Not enough textbooks
Students taking exams
Summary of results.
UCE Results:
| YEAR | D1 | D2 | C3 | C4 | C5 | C6 | P7 | P8 | F9 | TOTAL | % C/PASS |
|---|---|---|---|---|---|---|---|---|---|---|---|
| 2018 | 02 | 19 | 29 | 40 | 46 | 76 | 45 | 16 | 03 | 276 | 47.14 |
| 2017 | 09 | 18 | 67 | 60 | 47 | 43 | 23 | 08 | 01 | 276 | |
| 2016 | 16 | 26 | 44 | 45 | 35 | 25 | 08 | 03 | 00 | 202 | |
| 2015 | 07 | 20 | 46 | 39 | 37 | 30 | 19 | 05 | 01 | 204 | |
| 2014 | 04 | 17 | 26 | 46 | 38 | 39 | 50 | 28 | 03 | 251 | |
| 2013 | 07 | 13 | 40 | 49 | 41 | 41 | 21 | 16 | 01 | 232 | |
| 2012 | 01 | 09 | 17 | 45 | 53 | 60 | 34 | 25 | 18 | 268 | 42.13 |
| 2011 | 18 | 29 | 42 | 42 | 53 | 49 | 20 | 16 | 06 | 275 | 84.73 |
| 2010 | 06 | 19 | 26 | 33 | 51 | 43 | 26 | 21 | 10 | 235 | 75.74 |
| 2009 | 01 | 10 | 09 | 26 | 35 | 46 | 38 | 42 | 38 | 245 | 51.84 |
| 2008 | – | 07 | 09 | 22 | 46 | 53 | 29 | 41 | 27 | 234 | 58.55 |
| 2007 | 04 | 06 | 14 | 23 | 38 | 32 | 44 | 18 | 12 | 191 | 61.26 |
| 2006 | 03 | 08 | 20 | 37 | 42 | 46 | 34 | 23 | 09 | 222 | 70.27 |
| 2005 | 04 | 18 | 23 | 31 | 38 | 28 | 22 | 18 | 03 | 185 | 76.76 |
UACE RESULTS::
| YEAR | A | B | C | D | E | O | F | TOTAL | %PRINC. PASS |
|---|---|---|---|---|---|---|---|---|---|
| 2018 | |||||||||
| 2017 | 03 | 05 | 12 | 16 | 19 | 21 | 17 | 93 | |
| 2016 | 04 | 09 | 25 | 13 | 17 | 23 | 13 | 104 | |
| 2015 | 03 | 10 | 14 | 19 | 18 | 27 | 24 | 115 | |
| 2014 | 02 | 10 | 22 | 15 | 08 | 13 | 03 | 73 | |
| 2013 | 02 | 03 | 37 | 21 | 03 | 20 | 00 | 106 | |
| 2012 | 02 | 06 | 16 | 29 | 18 | 07 | 01 | 079 | 49.79 |
| 2010 | 07 | 18 | 30 | 17 | 02 | 14 | 01 | 089 | 83.15 |
| 2009 | 04 | 17 | 23 | 39 | 06 | 18 | 02 | 109 | 81.65 |
| 2008 | 01 | 10 | 29 | 34 | 16 | 17 | 02 | 109 | 82.57 |
| 2007 | 01 | 07 | 25 | 21 | 14 | 18 | 03 | 089 | 76.40 |
| 2006 | – | 05 | 17 | 31 | 18 | 38 | 03 | 112 | 63.39 |
| 2005 | – | 04 | 10 | 25 | 08 | 26 | 04 | 075 | 62.67 |
Generally, performance at both levels shows consistent improvement every year.


